Gulfstream Pipeline – No Imagery


Stretching 435 miles from Tampa to Mobile at a cost $1.468 billion the Gulfstream Natural Gas Pipeline, its rocky trenches and never before published mitigation sites have some of the best fishing in the Gulf.
“This is my go-to dive site if I am wanting to not only maximize the number of dives I can do in a day with the least amount of fuel burned, but also access just about every offshore reef fish species that the Gulf has to offer.” – Alex Fogg, Marine Resource Coordinator and Lionfish slayer extraordinaire.

In February we scanned the pipeline from seven miles out of Tampa pass to south of Pensacola using one of our sonar boats, a 50′ trawler, and a side scan sonar tow-fish. We used the data to create a fishing chart that outlines, marks, and names all the features we found.
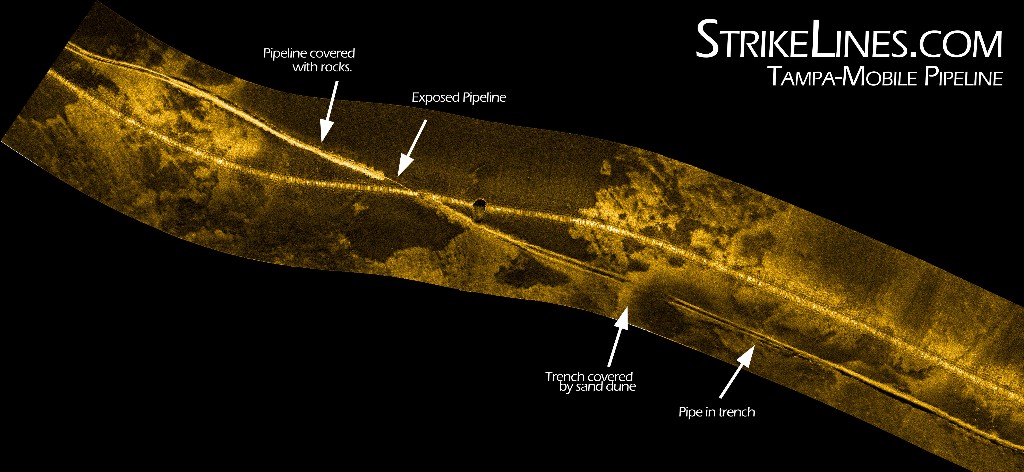
At the height of construction offshore, crews laid three to four miles of 36″ pipeline per day. In shallow water progress was slower and Gulfstream was required to bury the pipeline (our sonar data shows they met with limited success). Weather can damage oil platforms, refineries, and pipelines, thus the need to stabilize and bury the pipeline at depths of less than 200′. While dramatic improvements in weather monitoring can help minimize damage to oil assets that can be hardened or moved, the Gulfstream pipeline needed a permanent solution.
Hard bottom was avoided where possible and lifting buoys were used on
the barges’ anchor chains to minimize damage from chain sweep. Despite these efforts, damage to offshore habitats was inevitable. Trenching to bury the pipeline resulted in rocky spoils up to 25’ to either side in many areas. Hard substrate in other areas required pipeline stabilization with anchors and rocks. However, it’s difficult to know the true effect of the pipeline because Gulfstream was not required to take any environmental measurements before construction.
 In order to mitigate the damage Gulfstream used 153 artificial reef modules and 130,000 tons of limestone boulders to construct almost 50 acres of artificial hard bottom in Federal waters. In State waters Gulfstream constructed another 20 acres of artificial reefs.
The boulder fields are roughly 150m x 150m and each contain approximately 13,600 metric tons of limestone boulders, each greater than three feet in diameter. The boulders were transported offshore on barges and pushed overboard with heavy equipment.
We’ve had multiple reports of great Hogfish, grouper, and Yellowtails on these boulder fields. Mitigation monitoring shows significantly higher fish concentration and diversity at the boulder fields than on natural hard bottom.

The three artificial reef sites each consist of three groups of 17 artificial reef modules made of limestone rocks set in concrete. The reef modules are approximately six feet wide, nine feet long, six feet tall and contain a tunnel that runs end to end through the center.

Looks like a great place for lobster!

Sampling data from 2005 and 2006 showed that the boulder fields had consistently higher species diversity and abundance than undisturbed hard bottom control sites. The artificial reef modules performed similarly to the control sites.
There are six valve boxes along the pipeline from Tampa Bay to Mobile Bay, including one in Tampa Bay, one approximately 15 miles offshore from the Tampa pass, and the next closest at roughly 100 miles offshore. To our surprise the valve boxes have significantly less relief than some of the other pipeline sections.
Below are sonar images of the two offshore valve boxes closest to the Tampa pass. For size perspective the exterior of the pipe is approximately 44″.


If you’re interested in fishing the valve boxes we’ve found two YouTube videos from divers, here and here, that show what’s down there.
Our recommendation is try different spots along the pipeline. There are countless large rock piles, section of exposed pipeline, and trenches that look promising.

With the chart we are also releasing our sonar data that you can load and view in Google Earth. We are not releasing sonar data for the mitigation sites, only coordinates. The chart is available here.

If you’d like to learn more about the GNGS pipeline, we found the following useful in our research:
Dupont, Jennifer Maria. “Ecological Dynamics of Livebottom Ledges and Artificial Reefs on the Inner Central West Florida Shelf.” University of South Florida, 2009. University of South Florida Library, digital.lib.usf.edu/SFS0027158/00001.
Ferrufino, Agustin. “Marine Technology Society Meeting.” The Unique Design and Construction of the Gulfstream Natural Gas System, 25 Mar. 2004, www.mtshouston.org/pdfs/2004/march_2004_williams.pdf.
Schmidt, John, et al. “Environmental Mitigation-1: Monitoring, Analysis Show Rapid Gulf of Mexico Seafloor Recovery.” Oil & Gas Journal, vol. 105, no. 1, 1 Jan. 2007, www.ogj.com/articles/print/volume-105/issue-1/transportation/environmental-mitigation-1-monitoring-analysis-show-rapid-gulf-of-mexico-seafloor-recovery.html.
Schmidt, John, et al. “Environmental Mitigation-3: Limestone Boulders, Artificial Reef Modules Provide Seafloor Mitigation.” Oil & Gas Journal, vol. 105, no. 3, 15 Jan. 2007, www.ogj.com/articles/print/volume-105/issue-3/transportation/environmental-mitigation-3-limestone-boulders-artificial-reef-modules-provide-seafloor-mitigation.html.
Please note that information about the mitigation sites is scarce and coordinates have never been released to the public. There are discrepancies in the details that have been published, particularly the overall tonnage of limestone boulders used. We believe our information to be correct, but it should not be referenced for scientific or academic purposes. If you believe we’ve made an error, please let us know.