


3D Shelf Edge Synthetic (Gulf of Mexico)
$349
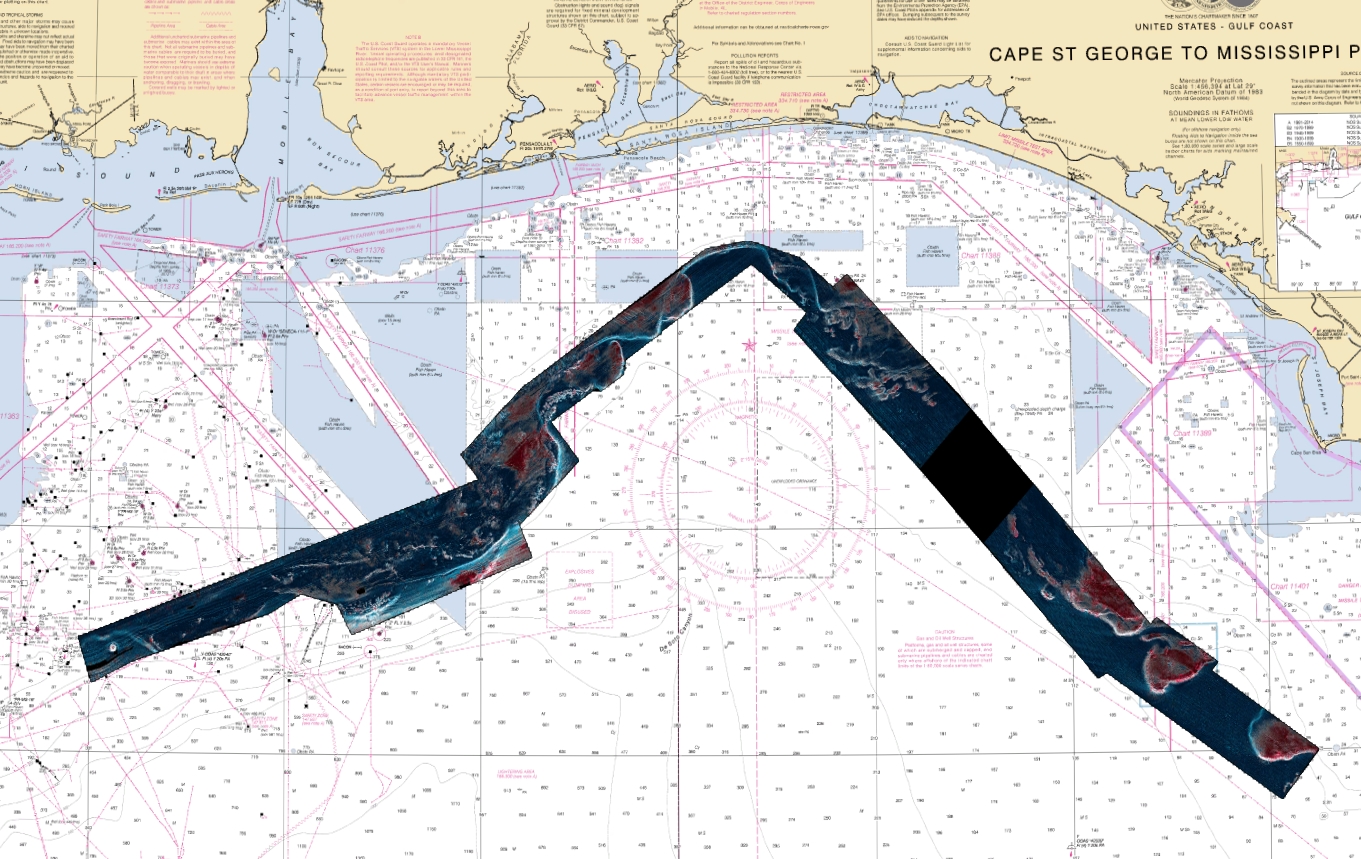
Shelf Edge Synthetic Gulf of Mexico fishing chart 3D with high resolution images of the seafloor.
**Preview map is LOW RESOLUTION. See gallery below for HD sample images**
- Description: Shelf Edge Gulf of Mexico fishing map features high definition 3D images of the seafloor.
- Location: Shelf Edge Gulf of Mexico fishing chart covers off the coasts of: Mississippi: SW of Gulfport, Biloxi, Pascagoula. Alabama: Dauphin Island, Mobile, Fairhope, Gulf Shores, Perdido Key. Northwest Florida: Pensacola, Navarre, Destin, Panama City Beach, Mexico Beach, Port St Joe, Apalachicola.
- Fishing Map Size: 1,800 square miles of potential fishing spots.
- Depths: 120 ft to 1,030 ft
- Works on: Lowrance, Simrad, Raymarine, B&G, VesselView, iPhone, iPad, and Android tablet. Got a Garmin? Click here. (See: StrikeLines GPS Unit Compatibility Chart)
- Resolution: High-resolution bottom hardness and ruggedness information.
- Notes: With StrikeLines’ HD view of the ocean floor you’ll see exactly where those potential fishing spots are on the map. See where all the rocks, reefs, ledges, wrecks and other structures are in realtime on your GPS unit, mobile device, or computer. This is not a numbers list! This makes numbers lists obsolete (We are very proud of this map).
-
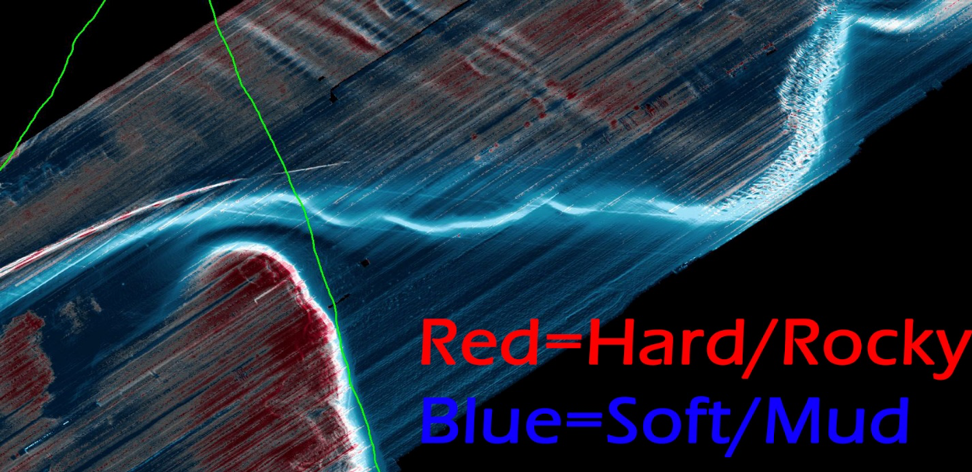
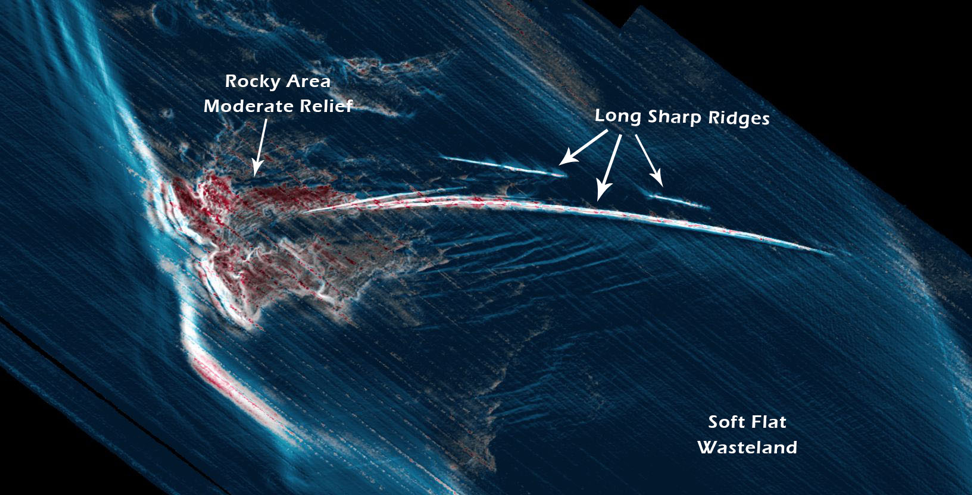
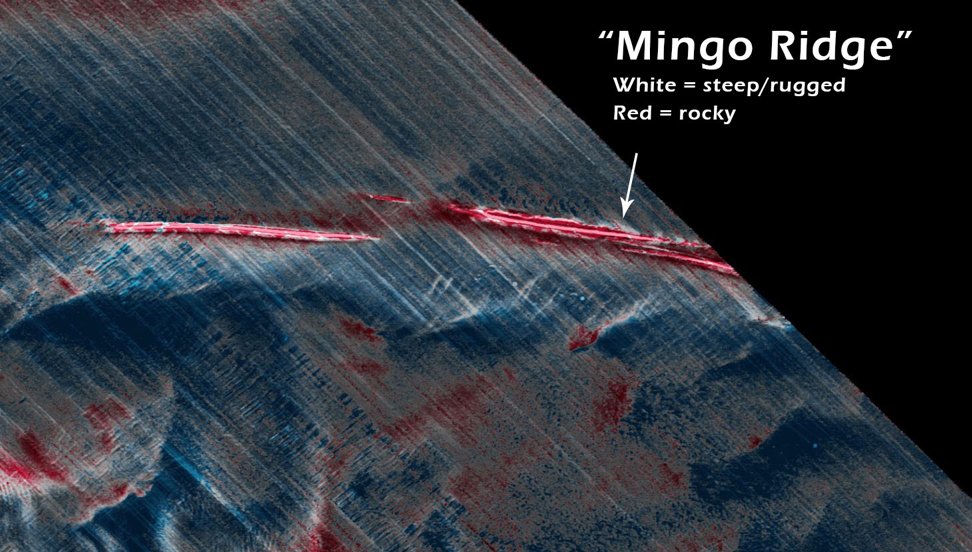
What’s the difference between the 3D Shelf Edge chart and the 3D Shelf Edge Synthetic chart?The 3D Shelf Edge was created just like our other 3D charts, based on tens of different sources of sonar data, including our own. The various colors represent the different depths (red=shallow, yellow=less shallow, then to green, blues, and all the way to deep blues and purples for the deepest areas).The Synthetic was created similarly, but using additional data that interprets the hardness and ruggedness information of the ocean floor. The bright/whiter areas are rugged (significant depth changes over short distances) and the dim are flat. The brighter an area is, the more rugged the bottom. If you’re looking for lots of relief, look for bright areas. If you want flat areas, look for dim areas. If you’re looking for Tilefish, which often burrow into muddy bottom, you’ll probably want to look for dim areas (little to no relief) blue in color. The blue signifies soft muddy bottom, while red signifies hard, normally rocky bottom. If you’re targeting a big grouper, you’ll want rocky (red) big relief (bright areas).
Related products
-

Pensacola Bay 2.0
$255 Select options -

Gulf of Mexico Oil Rig Platforms & Pipelines
$0 – $99 Select options -

Gulfstream Pipeline with Side Scan Imagery
$549 Select options -

Florida Public Reefs Spots
$0 – $99 Select options -

HardbottomHD for Aqua Map – iOS/Android
$650 Add to cart -

3D Louisiana Nearshore
$349 Select options -

Destin FL Public Reefs
$0 – $99 Select options -

Alabama Public Reefs
$0 – $99 Select options -

3D Louisiana Offshore / Flower Garden Banks
$349 Select options

